Address
We are a Gastronomic Consulting and Mentoring Agency based in the City of Miami, FL. - US
Work hours
Monday to Friday: 7 AM - 7 PM
Saturday: 10AM - 5PM
Address
We are a Gastronomic Consulting and Mentoring Agency based in the City of Miami, FL. - US
Work hours
Monday to Friday: 7 AM - 7 PM
Saturday: 10AM - 5PM
Efficient inventory management and supplier relationships determine the profitability of restaurants in Florida. This article analyzes data from the local food service market. Restaurants face specific challenges: a tropical climate, seasonal tourism, and managing local products. Precise control improves results.
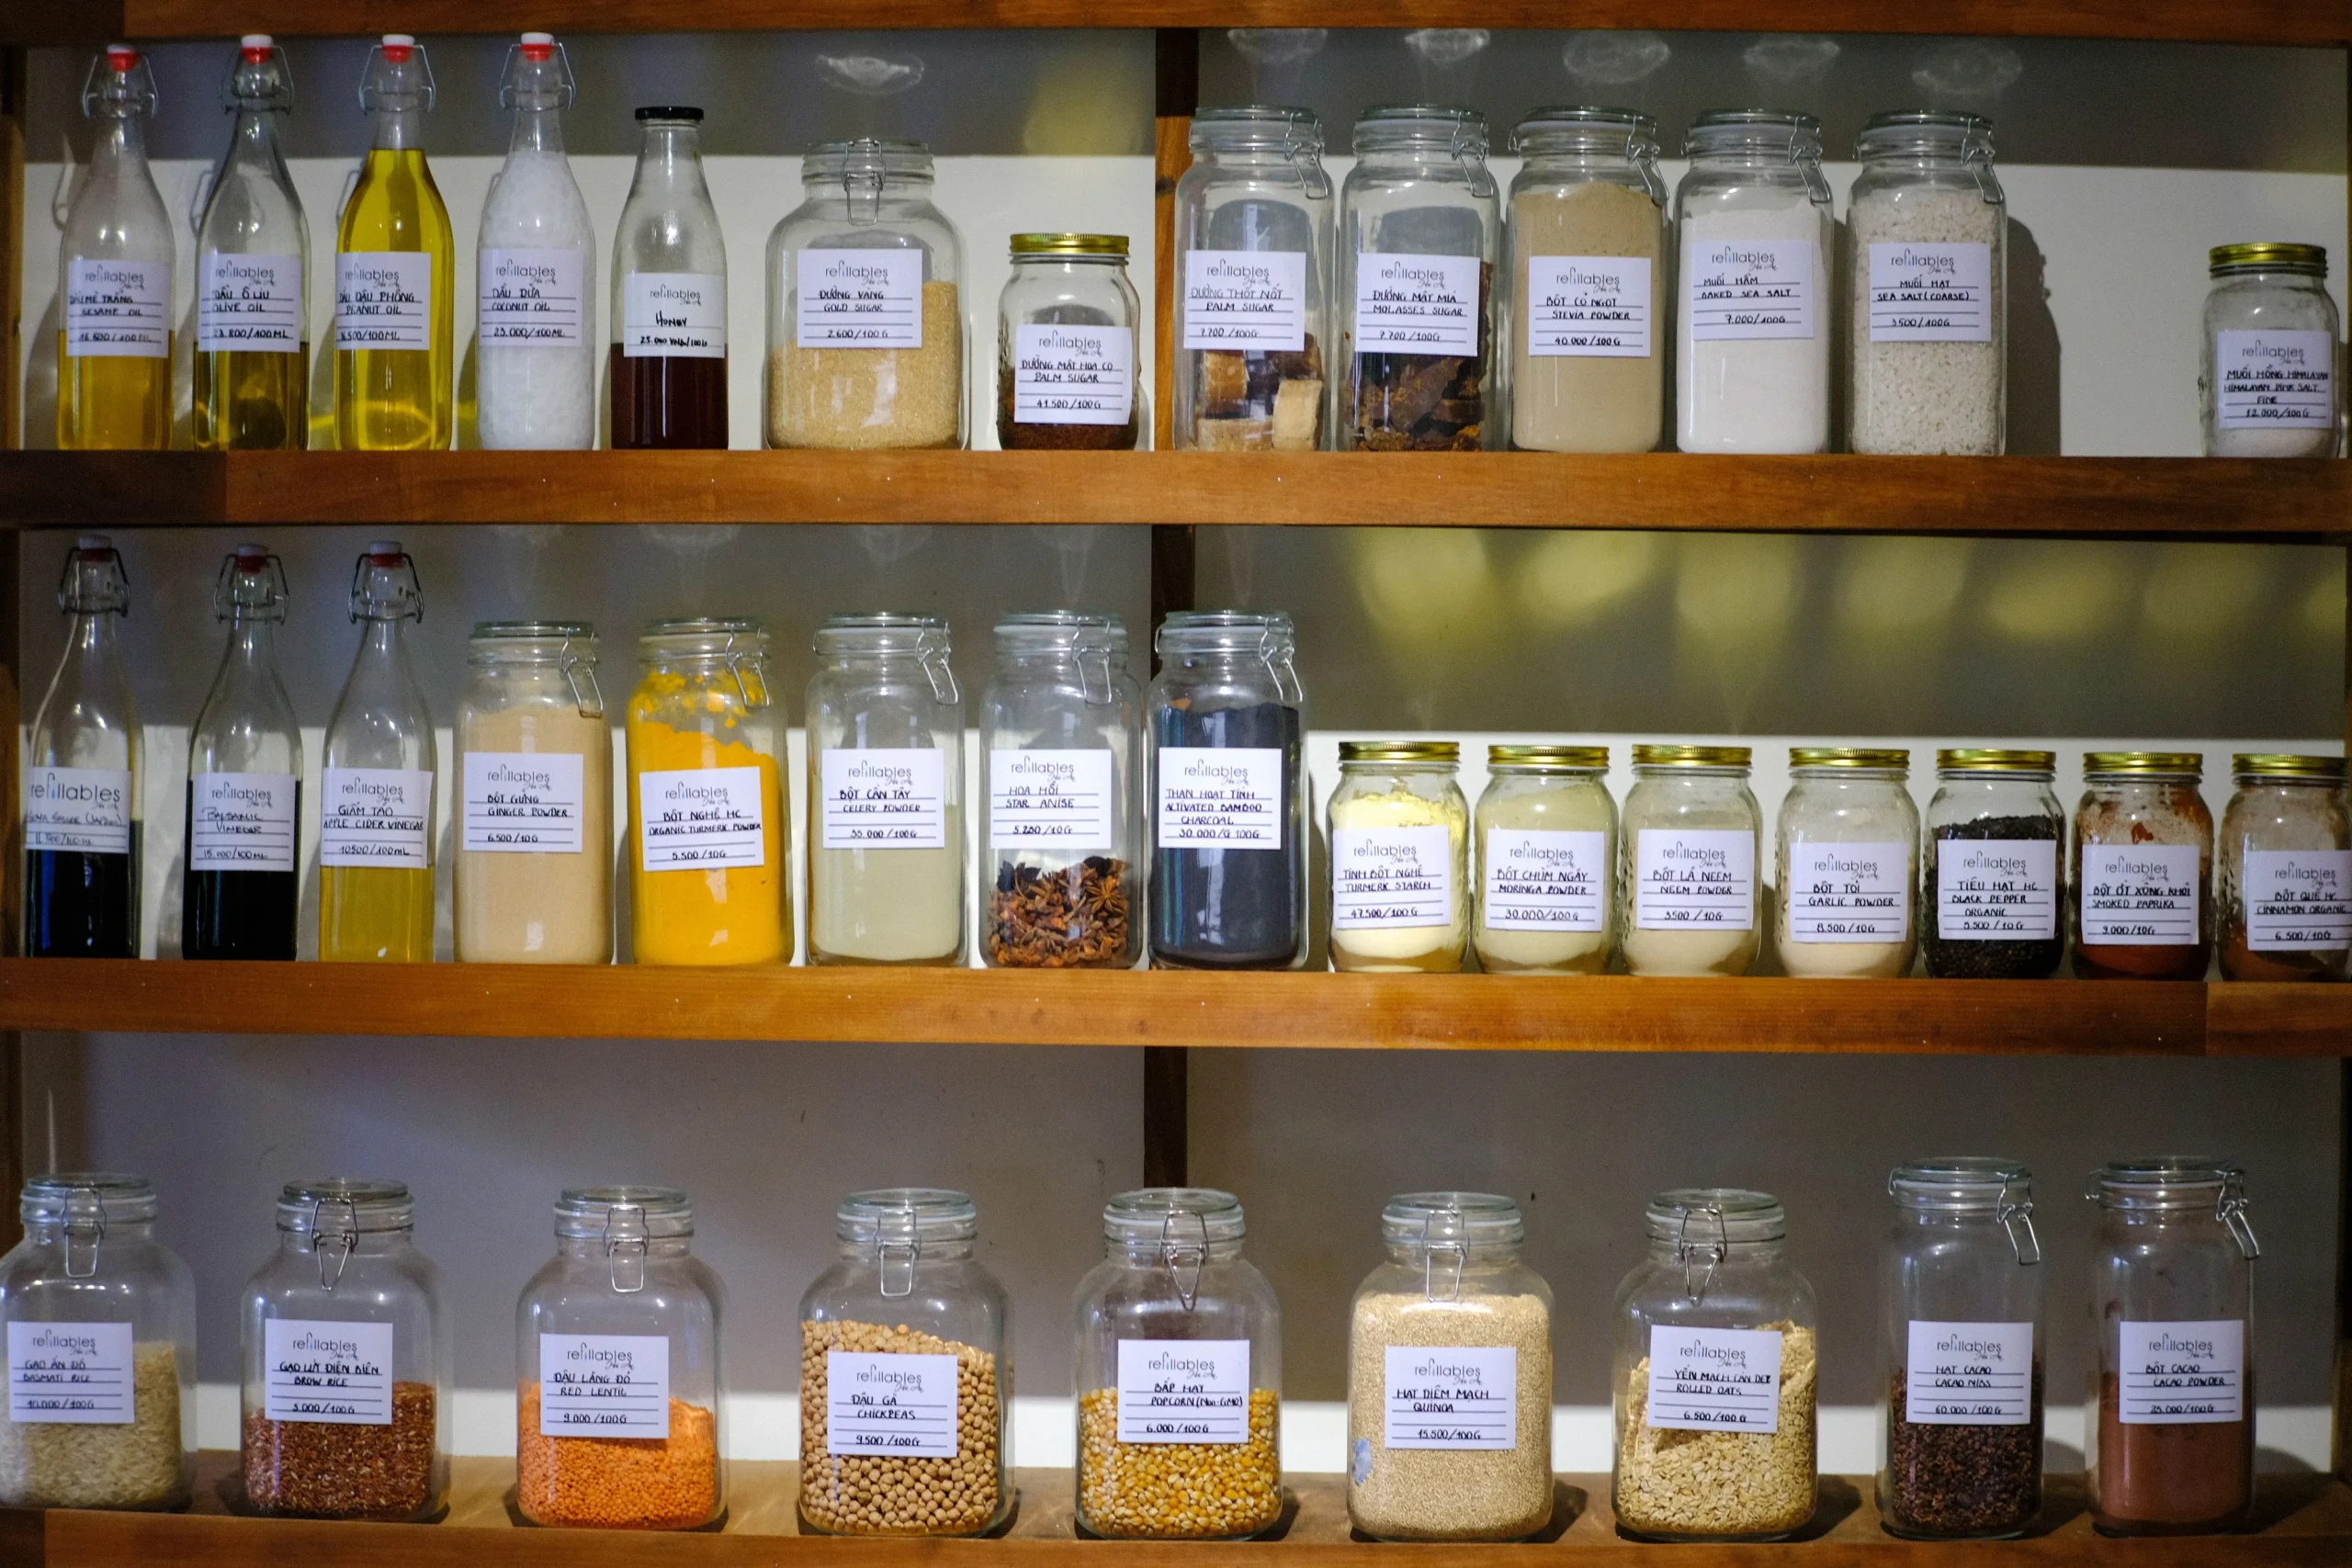
Efficient inventory management and supplier relationships determine the profitability of restaurants in Florida. This article analyzes data from the local restaurant market to offer practical strategies that reduce costs and optimize operations.
Restaurants in Florida face specific challenges in inventory control:
| Factor | Impact on Costs | Recommended Solution |
|---|---|---|
| Tropical climate | +15% losses | Advanced cooling systems |
| Tourist seasonality | +25% stock variation | Demand prediction by AI |
| Local produce | -20% logistics costs | Nearby suppliers network |
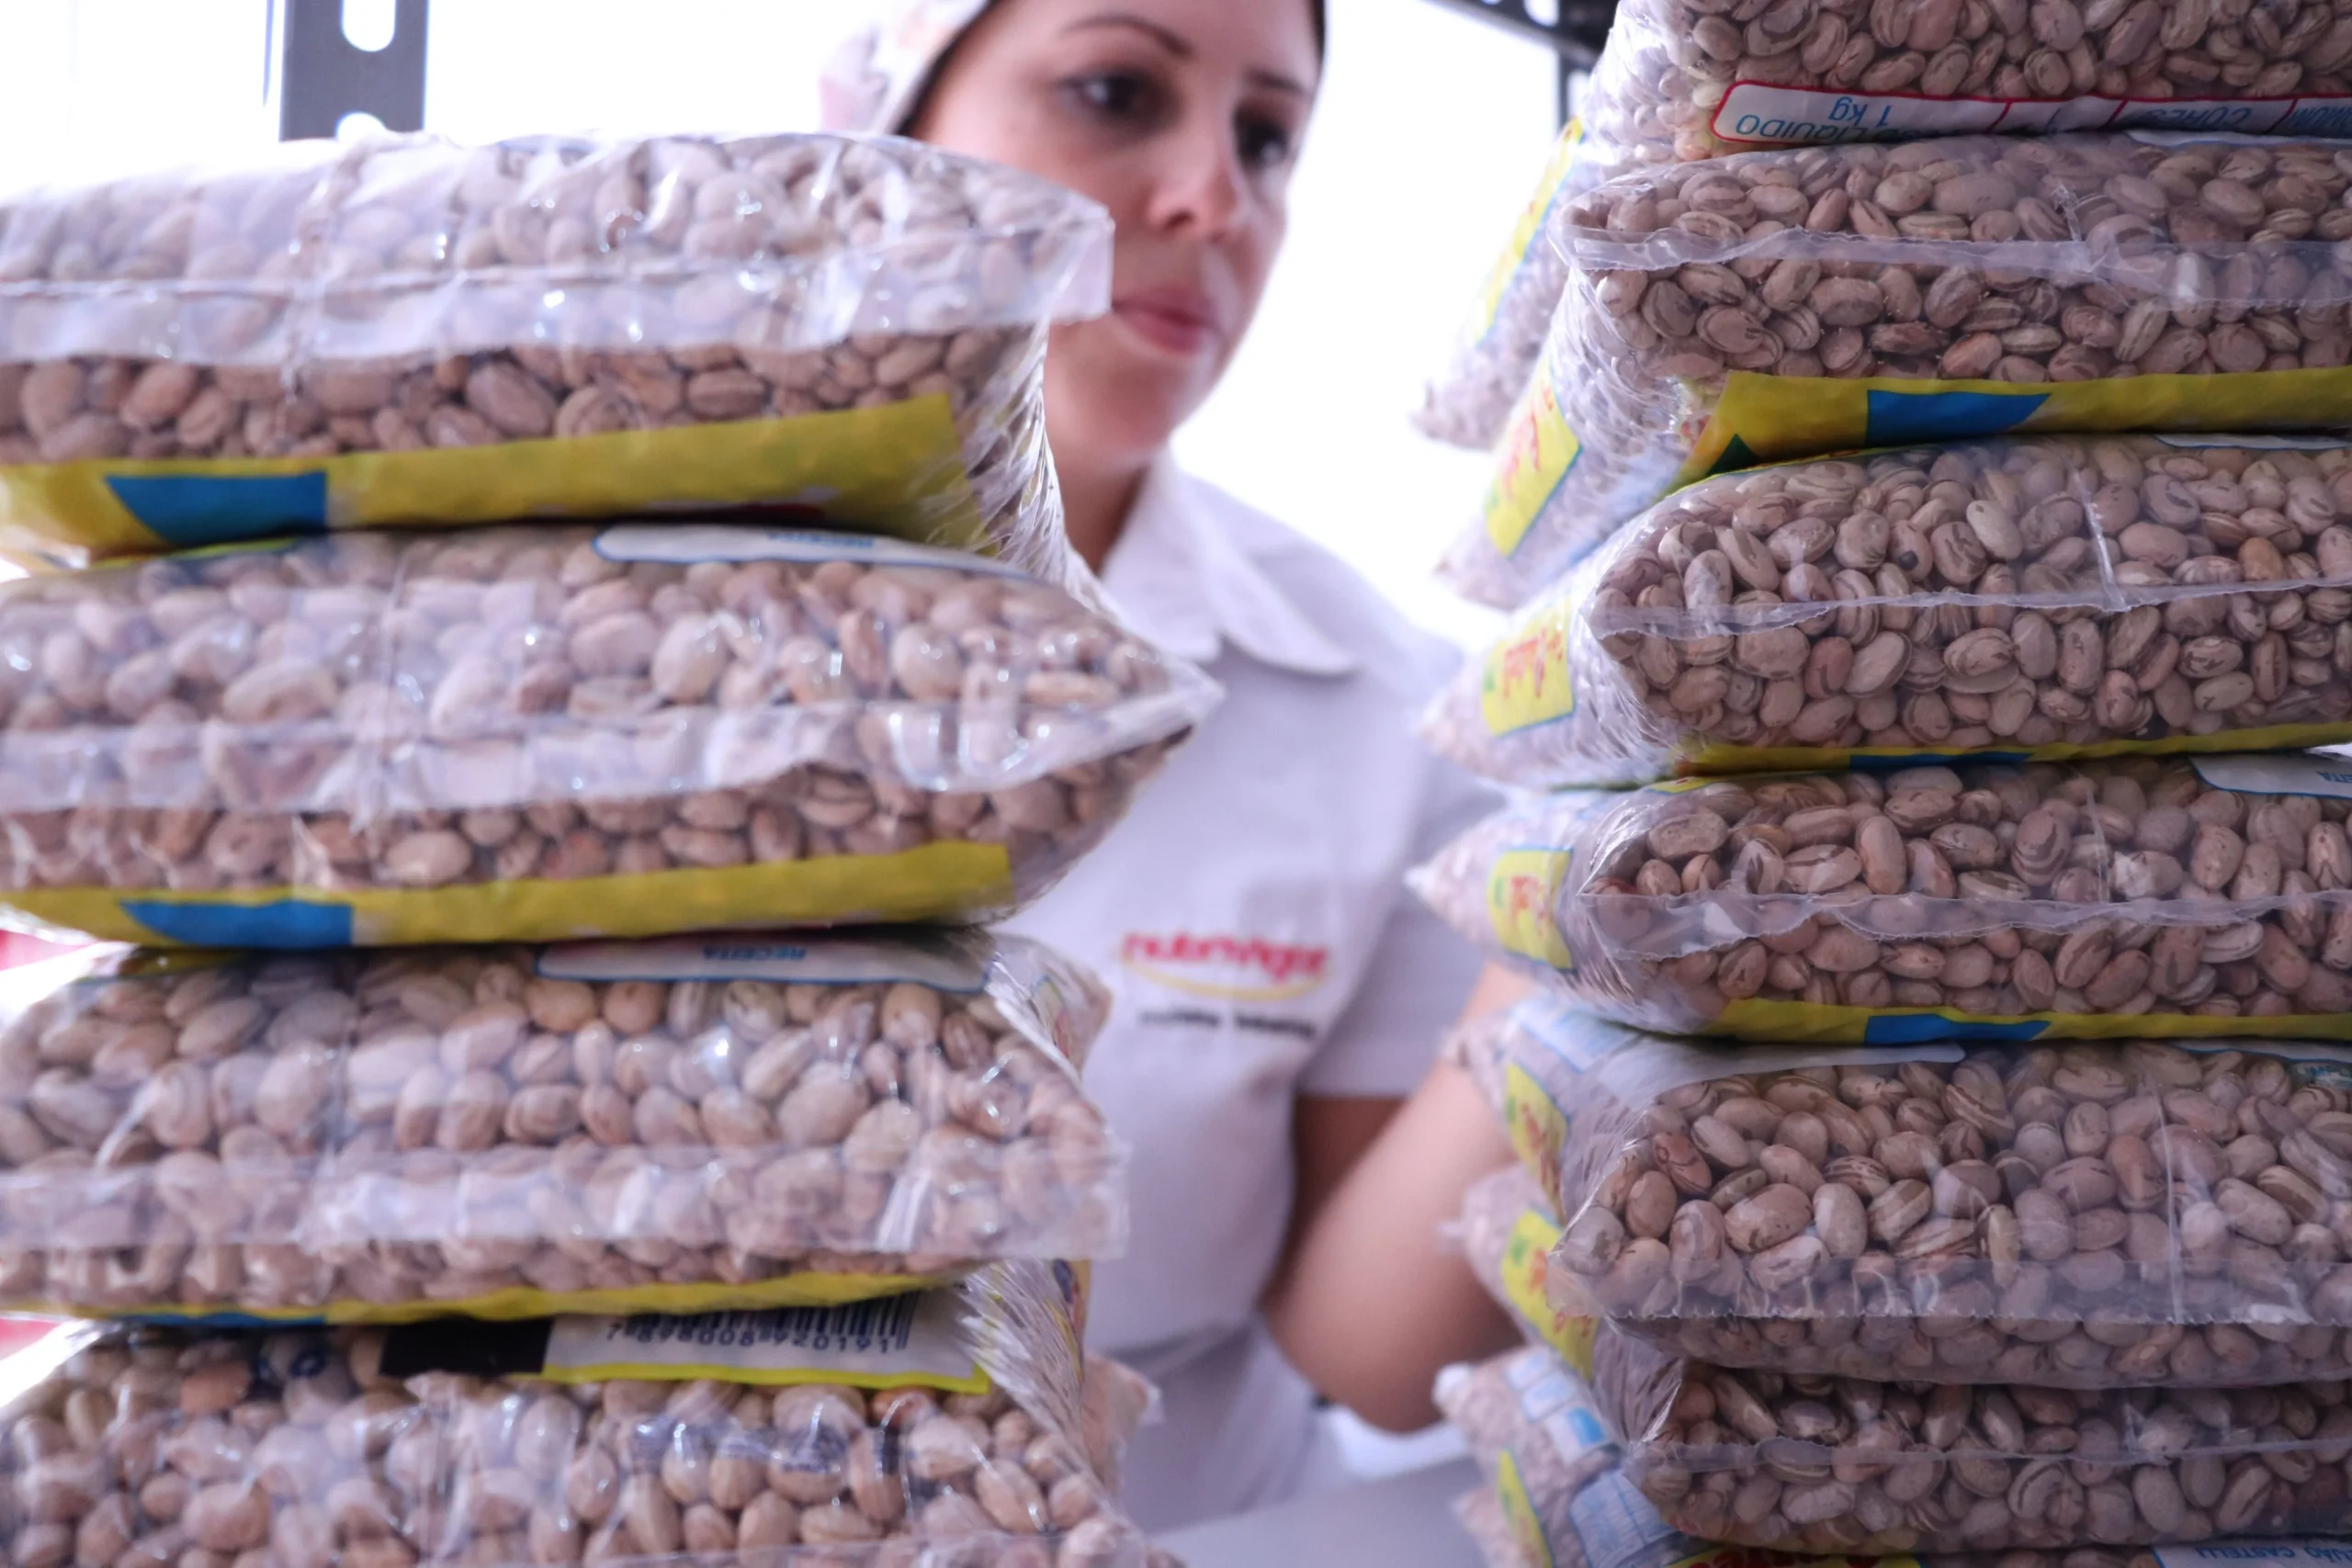
The success of inventory control depends on accurate indicators:
| Metric | Industry Standard | Optimized Goal | Financial impact |
|---|---|---|---|
| Inventory turnover | 15 days | 12 days | +8% margin |
| Shrinkage of fresh products | 4.5 % | 2% | +5% profit |
| Counting precision | 92 % | 98 % | +3% profit |
| Reception time | 45 minutes | 25 minutes | +2% productivity |
| Storage costs | 12% sales | 8% sales | +4% net profit |
Digitalization transforms inventory management:
| Technology | Principal function | ROI First Year |
|---|---|---|
| Active RFID | Real-time tracking | 245 % |
| IoT sensors | Temperature control | 180 % |
| Predictive AI | Demand forecast | 165 % |
| Blockchain | Product traceability | 140 % |
| Automation | Automatic orders | 135 % |
Cross-platform connectivity improves efficiency:
Suppliers define the quality of the final product:
| Criterion | Weight Assessment | Indicator Measurement | Minimum Goal |
|---|---|---|---|
| Quality products | 35 % | FDA Certifications | 3 minimum |
| Market prices | 25 % | Sector comparison | -10% average |
| Delivery times | 20 % | Compliance with schedule | 95 % |
| Support service | 20 % | Incident response | <2 hours |
Geographic diversification reduces risks:
| Supplier Type | Maximum Radio | Main Advantage | Estimated Savings |
|---|---|---|---|
| Fresh products | Milla 50 | Superior freshness | 15 % |
| Dairy | Milla 100 | Fast rotation | 12 % |
| non perishable | Milla 200 | Best price | 18 % |
| Imported | Port Miami | Direct access | 22 % |

Food cost control requires precision:
| Components | Ideal percentage | Control Method | Frequency |
|---|---|---|---|
| Raw material | 28-32% | Technical specifications | Diary |
| Labor | 18-22% | Productivity | Weekly |
| Waste | 2-4% | Losses record | Diary |
| Variations | ± 2% | Analysis of variance | Weekly |
Waste management impacts profitability:
| Type of loss | Main Cause | A satisfactory solution | Social Impact |
|---|---|---|---|
| Expiration | Over stock | Strict FIFO | -45% |
| Handling | Human error | Training | -35% |
| Temperature | Poor equipment | IoT Monitoring | -55% |
| Servings | Lack of standardization | Standard recipes | -40% |
Crisis preparedness minimizes losses:
| Scenario | Action Plan | Response Time | Implementation Cost |
|---|---|---|---|
| Supplier failure | Backup providers | <2 hours | 5% extra |
| Natural disaster | Emergency stock | Immediate | 8% reserve |
| Power outage | Generators | <15 minutes | 12% investment |
| Health crisis | Special protocols | <1 hour | 7% operational |
A quick response conserves resources:
Technology optimizes processes:
| System | Principal function | Annual ROI | Implementation Time |
|---|---|---|---|
| ERP Restaurant | Integral management | 280 % | 3 months |
| CRM Suppliers | business relations | 220 % | 2 months |
| WMS Warehouse | Stock control | 195 % | 1 month |
| BI Analytics | Data analysis | 175 % | 2 months |
Anticipation improves efficiency:
| Tools | Main Use | Precision | Our Mill |
|---|---|---|---|
| ML Demand | Sales prediction | 92 % | -15% stock |
| AI Trends | Market analysis | 88 % | +10% margin |
| Analytics | Consumption patterns | 90 % | -12% loss |
| Forecasting | Planning | 85 % | +8% efficiency |
Legal compliance protects operations:
| Appearance | Regulation | Control | Frequency |
|---|---|---|---|
| Temperature | 41°F maximum | IoT Sensors | 4 day |
| Labeled | FDA compliant | Digital check | Each product |
| Warehousing | Separation types | Inspection | 2 day |
| sanitization | FDA Protocol | Register | 3 day |
Certifications validate processes:
| Certification | Scope | Renewal | Annual cost |
|---|---|---|---|
| ServSafe | Staff | 2 years in the Making | $1,200 |
| HACCP | Processes | 1 year | $2,500 |
| ISO 22000 | Management system | 3 years in the Making | $5,000 |
| Local Health | Installations | 1 year | $800 |
Trained staff reduces errors:
| Program | Duration | Participants | Result |
|---|---|---|---|
| Basic inventory | 20 hours long. | New staff | -40% errors |
| advanced management | 40 hours long. | Supervisors | +35% efficiency |
| specific software | 15 hours long. | Key users | -25% time |
| Crisis protocols | 10 hours long. | All staff | +45% response |
Monitoring ensures improvement:
| Appearance | Method | Frequency | Social Impact |
|---|---|---|---|
| Knowledge | Tests | Quarterly | +25% accuracy |
| Skills | Practice | Monthly | -30% errors |
| Efficiency | Metrics | Weekly | +20% productivity |
| Adaptation | Feedback | Biweekly | +15% performance |
The return justifies improvements:
| Investment | Initial cost | ROI 12 Months | Payback |
|---|---|---|---|
| digital system | $25,000 | 245 % | 5 months |
| Training | $15,000 | 180 % | 7 months |
| Equipment | $35,000 | 165 % | 8 months |
| Book a Consultation | $20,000 | 220 % | 6 months |
KPIs measure success:
| Indicator | Current Base | Goal 90 Days | Social Impact |
|---|---|---|---|
| Rotation | 15 days | 12 days | +8% margin |
| Precision | 92 % | 98 % | +5% profit |
| Decrease | 4.5 % | 2% | +4% profit |
| Costs | 32 % | 28 % | +6% profitability |
Complete operational transformation:
| Area | Before | After | Improve |
|---|---|---|---|
| Decrease | 8% | 2.5 % | 68.75 % |
| Rotation | 18 days | 11 days | 38.89 % |
| Costs | 35 % | 29 % | 17.14 % |
| ROI | 312 % | 1st year |
Process optimization:
| Appearance | Initial situation | Result | Time |
|---|---|---|---|
| Overrun | 45 % | 28 % | 6 months |
| Efficiency | 65 % | 88 % | 3 months |
| Precision | 89 % | 97 % | 2 months |
| Our Mill | Base | + 35 % | 12 months |
Detailed phased plan:
| Phase | Duration | Objectives | Deliverables |
|---|---|---|---|
| Discovery | 2 weeks | Current analysis | Initial report |
| Planning | 2 weeks | System design | Action plan |
| Implementación | 4 weeks | Start-up | Operating System |
| Board | 4 weeks | final adjustments | Success metrics |
Investment required:
| Resource | Quantity | Cost | ROI |
|---|---|---|---|
| Staff | 3 FTEs | $ 12,000 / month | 180 % |
| Software | 1 system | $25,000 | 245 % |
| Hardware | Various equipment | $15,000 | 165 % |
| Training | 40 hours long. | $8,000 | 220 % |

Efficient inventory and supplier management reduces costs by 15-25%. Restaurants that implement these systems achieve:
To transform inventory management in your restaurant, contact our experts:
Additional references and resources available at:
Subscribe and receive the latest posts in your email.
















[…] For specific implementations, see our article on inventory and supplier management for restaurants in Florida. […]
For more information on how to implement these strategies, you can visit InGastro Concepts, where you'll find specialized resources on inventory and supplier management.
[…] Specialized consultants can guide restaurants in implementing these strategies, ensuring optimal resource control and efficient budget management. […]
[…] to help restaurants optimize their processes and improve their operational efficiency. Discover how InGastro Concepts can boost […]
Successful restaurants implement specific strategies that maximize profitability without compromising quality. These techniques have been refined by consultants specializing in inventory management and suppliers.
[…] For more information on how to implement these systems in your restaurant, visit our guide at InGastro Concepts. […]
For those interested in improving their management, InGastro Concepts offers expert advice on inventory and suppliers, helping to maximize […]
Among the most prominent tools are inventory management systems, such as Leanpath, which allow for monitoring and predicting food consumption. These solutions not only reduce the […]
[…] the restaurant's actual needs. This can be achieved through technological tools such as management systems based on [information missing], which offer real-time visibility into the levels of […]